JProfiler x64 - X 64-bit Download
Popular x64 Tags
- windows x64 download
- tool x64 download
- software x64 download
- view x64 download
- editor x64 download
- python x64 download
- xml x64 download
- sql x64 download
- dll x64 download
- resource x64 download
- compare x64 download
- csv x64 download
- dotnet x64 download
- uml x64 download
- table x64 download
- delphi x64 download
- xls x64 download
- perl x64 download
- html x64 download
- diff x64 download
- database x64 download
- query x64 download
- convert x64 download
- sql tools x64 download
- ide x64 download
- sql tool x64 download
- activestate x64 download
- doc x64 download
- txt x64 download
- mssql x64 download
JProfiler x64 14.0.3
Sponsored links:
ej-technologies GmbH

JProfiler x64 is an award-winning all-in-one Java profiler. JProfiler's intuitive GUI helps you find performance bottlenecks, pin down memory leaks and resolve threading issues.
JProfiler supports the following modes of operation:
Live profiling of a local session
Once you define how your application is started, JProfiler can profile it and you immediately see live data from the profiled JVM. To eliminate the need for session configuration, you can use one of the many IDE plugins to profile the application from within your favorite IDE.
Live profiling of a remote session
By modifying the VM parameters of the java start command you can get any Java application to listen for a connection from the JProfiler GUI. The profiled application can not only run on your local computer, JProfiler can attach to a profiled application over the network. In addition, JProfiler provides numerous integration wizards for all popular application servers that help you in setting up your application for profiling.
Offline profiling
You do not have to connect with the JProfiler GUI to the profiled application in order to profile it: With offline profiling you can use JProfiler's powerful trigger system or the JProfiler API to control the profiling agent and save snapshots to disk. At a later time you can open these snapshots in the JProfiler GUI or programmatically export profiling views with the command line export tool or the export ant task.
Snapshot comparisons
In JProfiler, you can save a snapshot of all current profiling data to disk. JProfiler offers a rich comparison facility to see what has changed between two or more snapshots. Alternatively you can create comparison reports programmatically with the command line comparison tool or the comparison ant task.
Viewing an HPROF snapshot
JProfiler can open HPROF snapshots that have been taken with JVM tools such as jconsole or jmap or that have been triggerd by the -XX:+HeapDumpOnOutOfMemoryError JVM parameter.
The following list gives a high level overview of the profiling views in JProfiler:
Memory profiling
JProfiler's memory view section offers dynamically updated views on memory usage and views that show information about allocations spots. All views have several aggregation levels and can show live and garbage collected objects.
All objects
Shows classes or packages of all objects on the heap with instance counts and size information. You can mark current values and show differences.
Recorded objects
Shows classes or packages of all recorded objects. You can mark current values and show differences.
Allocation call tree
Shows a call tree or methods, classes, packages or Java EE components with annotated allocations of selected classes.
Allocation hot spots
Shows a list of methods, classes, packages or Java EE components that allocate selected classes. You can mark current values and show differences. The tree of backtraces can be shown for each hot spot.
Class tracker
Shows a timeline with a graph of instance counts for selected classes.
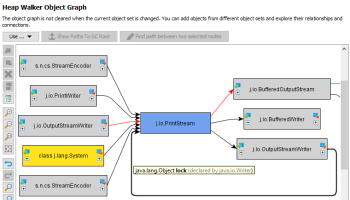
Heap walker
In JProfiler's heap walker you can take a snapshot of the heap and drill down to objects of interest by performing selection steps. The heap walker has five views:
Classes
Shows all classes and their instances.
Allocations
Shows allocation tree and allocation hot spots for recorded objects.
Biggest objects
Shows the objects that block the largest parts of the heap from being garbage collected. The dominator tree can be expanded in place to show these retained objects.
References
Shows a graph of references for individual objects and offers a "show path to garbage collector root" functionality. Also offers cumulated views for incoming and outgoing references.
Data
Shows instance and class data for individual objects.
Time
Shows a time-resolved histogram of recorded objects.
JProfiler supports the following modes of operation:
Live profiling of a local session
Once you define how your application is started, JProfiler can profile it and you immediately see live data from the profiled JVM. To eliminate the need for session configuration, you can use one of the many IDE plugins to profile the application from within your favorite IDE.
Live profiling of a remote session
By modifying the VM parameters of the java start command you can get any Java application to listen for a connection from the JProfiler GUI. The profiled application can not only run on your local computer, JProfiler can attach to a profiled application over the network. In addition, JProfiler provides numerous integration wizards for all popular application servers that help you in setting up your application for profiling.
Offline profiling
You do not have to connect with the JProfiler GUI to the profiled application in order to profile it: With offline profiling you can use JProfiler's powerful trigger system or the JProfiler API to control the profiling agent and save snapshots to disk. At a later time you can open these snapshots in the JProfiler GUI or programmatically export profiling views with the command line export tool or the export ant task.
Snapshot comparisons
In JProfiler, you can save a snapshot of all current profiling data to disk. JProfiler offers a rich comparison facility to see what has changed between two or more snapshots. Alternatively you can create comparison reports programmatically with the command line comparison tool or the comparison ant task.
Viewing an HPROF snapshot
JProfiler can open HPROF snapshots that have been taken with JVM tools such as jconsole or jmap or that have been triggerd by the -XX:+HeapDumpOnOutOfMemoryError JVM parameter.
The following list gives a high level overview of the profiling views in JProfiler:
Memory profiling
JProfiler's memory view section offers dynamically updated views on memory usage and views that show information about allocations spots. All views have several aggregation levels and can show live and garbage collected objects.
All objects
Shows classes or packages of all objects on the heap with instance counts and size information. You can mark current values and show differences.
Recorded objects
Shows classes or packages of all recorded objects. You can mark current values and show differences.
Allocation call tree
Shows a call tree or methods, classes, packages or Java EE components with annotated allocations of selected classes.
Allocation hot spots
Shows a list of methods, classes, packages or Java EE components that allocate selected classes. You can mark current values and show differences. The tree of backtraces can be shown for each hot spot.
Class tracker
Shows a timeline with a graph of instance counts for selected classes.
Heap walker
In JProfiler's heap walker you can take a snapshot of the heap and drill down to objects of interest by performing selection steps. The heap walker has five views:
Classes
Shows all classes and their instances.
Allocations
Shows allocation tree and allocation hot spots for recorded objects.
Biggest objects
Shows the objects that block the largest parts of the heap from being garbage collected. The dominator tree can be expanded in place to show these retained objects.
References
Shows a graph of references for individual objects and offers a "show path to garbage collector root" functionality. Also offers cumulated views for incoming and outgoing references.
Data
Shows instance and class data for individual objects.
Time
Shows a time-resolved histogram of recorded objects.
OS: Windows Vista x64, Windows 7 x64, Windows 8 x64, Windows 10 x64, Windows 11
Add Your Review or 64-bit Compatibility Report
Top Other 64-bit downloads


Android Studio 2025.3.1 Panda 1
Android Studio: Powerful IDE for Android app development with robust tools.
Freeware

Android NDK x64 Revision 26d
Lets you build performance-critical portions of your apps in native code
Freeware


JProfiler 15.0.4
JProfiler is a powerful Java profiler for performance tuning and memory analysis.
Trialware | $549.00

Docker 4.62.0

Streamline your development with Docker: portable, efficient containerization.
Shareware | $11.00


Flyff 2.4.9
Vagrant simplifies environment setup for developers with portable, reproducible workflows.
Open Source
Members area
Top 64-bit Downloads
-
Android NDK x64 Revision 26d
x64 freeware download -
PilotEdit Pro x64 20.6.0
x64 shareware download -
Scanner Pro SDK ActiveX
x64 1.0
x64 shareware download -
install4j x64 10.0.6
x64 trialware download -
dirtyJOE x64 1.7 (c529)
x64 freeware download -
MADARA for Windows x64
bit 3.0.0
x64 open source download -
Racket 64bit 8.13
x64 freeware download -
psutil for Windows Vista
(x64 bit) 5.6.5
x64 open source download -
Java Service Wrapper
Professional Edition x64 3.5.25
x64 shareware download -
OraBone x64 8.5.0
x64 freeware download
Top Downloads
-
NASM 2.16.01
open source download -
VMProtect Ultimate 2.13.2
demo download -
Devart UniDAC 11.0.0
shareware download -
Precision Language Suite 2.5
freeware download -
Android Studio 2025.3.1 Panda 1
freeware download -
Zlib 1.3.1
freeware download -
OllyDbg 2.01
freeware download -
Android NDK x64 Revision 26d
freeware download -
PyScripter Portable 4.3.4
open source download -
PHP 8.5.3
open source download -
Devart ODAC 14.0.0
shareware download -
TMS FNC UI Pack 1.0.0.0
shareware download -
.NET FTP Library 8.05
shareware download -
Help+Manual 10.1.0
shareware download -
JProfiler 15.0.4
trialware download