PerfMonitor - X 64-bit Download
Popular x64 Tags
- freeware x64 download
- windows x64 download
- free x64 download
- web x64 download
- software x64 download
- folder x64 download
- utility x64 download
- monitor x64 download
- convert x64 download
- download x64 download
- tool x64 download
- video x64 download
- memory x64 download
- audio x64 download
- text x64 download
- password x64 download
- editor x64 download
- file x64 download
- security x64 download
- image x64 download
- database x64 download
- jpeg x64 download
- icon x64 download
- organizer x64 download
- viewer x64 download
- data x64 download
- print x64 download
- edit x64 download
- search x64 download
- pim x64 download
PerfMonitor 2.04
Sponsored links:
license: Freeware
downloads: 33
size: 922 kB
updated: 2014-12-26
tags: CPU monitor, CPU Monitoring, Performance monitor, Processor monitor, Monitoring software, Monitoring tool, Disk monitor, Network monitor, Perf Monitor
Add to Basket
CPUID

PerfMonitor2 (PM2) is a processor performance and monitoring tool. It allows to track up to 4 processor-related events choosen in a model-specific list. It succeeds to PerfMonitor, and in addition to that first version, PM2 includes monitoring data, like temperatures and powers.
PerfMonitor can be used to identify the performance bottlenecks of a system, or to monitor a program for cache-miss rate or mis-predicted branches. But PerfMonitor can also be used as a hardware-level CPU comparison tool, comparing the key parameters of different CPUs runnning the same benchmark.
Install PM2 (setup version)
Run the setup executable file, and let it guide you for the installation process.
How to use PM2
Using PM2 does not require to be a hardware specialist, on the contrary it was designed to b very easy to use. Nethertheless, some basic processor notions are recommanded to use PM2 at its best.
Terminology
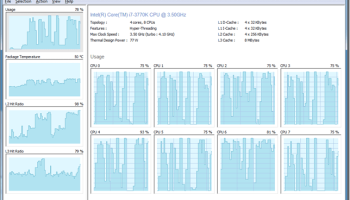
A processor refers to a socket or a package. It includes one or several cores. Each core consists in one or two CPUs (two in the case of the support of Hyper-Threading). A counter represents an event tracked on the processor. Depending on the event, it can be reported at the CPU level (for example CPU usage), the core level (for example core temperature), or at the processor level (for example package power).
Interface
PM2 consists in two views :
The counter selection view includes 4 processor counters and allows to choose the counters to track. When possible, the data reported on these counters are at the processor level.
The CPU counter view shows the counter value at the processor, core or CPU level. It does also include basic information on the processor.
Processors, counters configurations and counters selection
Select a processor
If your system includes more than one processor, you can select the processor to monitor by selecting it in the menu Selection ? Processor. You can then view the list of available counters in the menu Selection ? Counters.
Select a counter
In the counter selection view, left click on a graph to select it. You can change the counter either by right clicking on the selected graph, and choose the counter in the menu, either by selecting it in the menu Selection ? Counters. A check will indicate the current counter selection.
Counters Configurations
The nature and the number of counters depends on the processor model and family. Some counters are using the processor 's performance monitoring features, and because performance monitoring does only allow a few number of events to be monitored in the same time, PM2 allows to switch between several counters configurations. Some counters are present in all configurations, and some others are only available with a specific configuration. The table below shows all the counters available on the supported processors. You can select the counters configuration in menu Selection ? Counters Configurations. The Selection ? Counters menu is dynamically updated to include the counters that are available in the current configuration.
Counters definition
Caches request rate and hit ratio
The cache requests rate is the ratio between the number of requests to that cache and the total number of instructions. The cache hit ratio is the ratio between the number of requests to the cache that resulted in a success (the required data was found in the cache) and the total number of requests to the cache.
Branch Instructions rate and branch hit ratio
Branch instructions rate is the ratio between the number of branch instructions (x86 jz/jnz/jg …) and the total number of instructions. The hit ratio reflects the performance of the branch prediction mechanism.
PerfMonitor can be used to identify the performance bottlenecks of a system, or to monitor a program for cache-miss rate or mis-predicted branches. But PerfMonitor can also be used as a hardware-level CPU comparison tool, comparing the key parameters of different CPUs runnning the same benchmark.
Install PM2 (setup version)
Run the setup executable file, and let it guide you for the installation process.
How to use PM2
Using PM2 does not require to be a hardware specialist, on the contrary it was designed to b very easy to use. Nethertheless, some basic processor notions are recommanded to use PM2 at its best.
Terminology
A processor refers to a socket or a package. It includes one or several cores. Each core consists in one or two CPUs (two in the case of the support of Hyper-Threading). A counter represents an event tracked on the processor. Depending on the event, it can be reported at the CPU level (for example CPU usage), the core level (for example core temperature), or at the processor level (for example package power).
Interface
PM2 consists in two views :
The counter selection view includes 4 processor counters and allows to choose the counters to track. When possible, the data reported on these counters are at the processor level.
The CPU counter view shows the counter value at the processor, core or CPU level. It does also include basic information on the processor.
Processors, counters configurations and counters selection
Select a processor
If your system includes more than one processor, you can select the processor to monitor by selecting it in the menu Selection ? Processor. You can then view the list of available counters in the menu Selection ? Counters.
Select a counter
In the counter selection view, left click on a graph to select it. You can change the counter either by right clicking on the selected graph, and choose the counter in the menu, either by selecting it in the menu Selection ? Counters. A check will indicate the current counter selection.
Counters Configurations
The nature and the number of counters depends on the processor model and family. Some counters are using the processor 's performance monitoring features, and because performance monitoring does only allow a few number of events to be monitored in the same time, PM2 allows to switch between several counters configurations. Some counters are present in all configurations, and some others are only available with a specific configuration. The table below shows all the counters available on the supported processors. You can select the counters configuration in menu Selection ? Counters Configurations. The Selection ? Counters menu is dynamically updated to include the counters that are available in the current configuration.
Counters definition
Caches request rate and hit ratio
The cache requests rate is the ratio between the number of requests to that cache and the total number of instructions. The cache hit ratio is the ratio between the number of requests to the cache that resulted in a success (the required data was found in the cache) and the total number of requests to the cache.
Branch Instructions rate and branch hit ratio
Branch instructions rate is the ratio between the number of branch instructions (x86 jz/jnz/jg …) and the total number of instructions. The hit ratio reflects the performance of the branch prediction mechanism.
OS: Windows 2000, Windows 2003, Windows XP, Windows Vista, Windows Vista x64, Windows 7, Windows 7 x64, Windows 8, Windows 8 x64, Windows 10, Windows 10 x64
Add Your Review or 64-bit Compatibility Report
Top Other 64-bit downloads


iSunshare iBypass Genius 3.1.2.1
bypass icloud activation lock and turn off FMI without password
Shareware | $19.95


Caffeine 1.98
Keep your computer awake effortlessly with Caffeine, the ultimate productivity tool.
Freeware

Windows 7 x64
Windows 7 x64 is the next release of the Windows client operating system
Trialware | $199.99


Chopping List 1.0.5.1
Split the content of text files into multiple new files using a custom delimiter
Freeware


Windows 10 x64 22H2
Windows 10 x64 demonstrates new levels of flexibility, navigation & familiarity
Trialware
Members area
Top 64-bit Downloads
-
HWiNFO64 6.28 B4200
x64 freeware download -
Windows 7 x64
x64 trialware download -
GRBackPro Server Backup
x64 11.2.0
x64 shareware download -
XtraTools Professional
x64 26.3.1
x64 shareware download -
DAR 2.7.14
x64 open source download -
Windows 10 x64 22H2
x64 trialware download -
Processor X32 or X64 1.5
x64 freeware download -
EasyTune6 B24.0119.1
x64 freeware download -
CIB pdf brewer 4.20.0
x64 freeware download -
3DMark 2.29.8282
x64 freeware download
Top Downloads
-
FreeCommander XE
Portable 2026 Build 941
freeware download -
FURY CTRL 2.0.65.0
freeware download -
FMDiff 4.0.5
demo download -
Open Files from XLSX to
XLS 5.2
shareware download -
Vim 9.2.0271
open source download -
iSunshare iBypass Genius 3.1.2.1
shareware download -
Shell Tools 2.0.1
freeware download -
EaseUS Key Finder 4.1.6 Build 20240910
demo download -
HWiNFO64 6.28 B4200
freeware download -
AnyMP4 Data Recovery 1.5.12
shareware download -
PCtransfer 1.0.0.1033
freeware download -
Software to Data
Recovery 5.8.4.1
shareware download -
Pitara 5.0.9583.34420
open source download -
WinFindr 1.9
shareware download -
Windows 7 Service Pack 1 7601.17514.1011
freeware download