VistaTrades - X 64-bit Download
Popular x64 Tags
- stock x64 download
- technical analysis x64 download
- historical x64 download
- trading system x64 download
- signals x64 download
- forex x64 download
- day trading x64 download
- quotes x64 download
- software x64 download
- currency x64 download
- analysis x64 download
- forex software x64 download
- futures x64 download
- trading x64 download
- online trading x64 download
- financial x64 download
- forex trading x64 download
- stock market x64 download
- portfolio x64 download
- investment x64 download
- currency trading x64 download
- options x64 download
- expert advisor x64 download
- funds x64 download
- stocks x64 download
- ticker x64 download
- turbo x64 download
- forex signals x64 download
- forex tracer x64 download
- etoro x64 download
VistaTrades 2.8.9
Sponsored links:
license: Freeware
downloads: 557
size: 14.57 MB
updated: 2017-05-02
tags: vistatrades, stock, free stock software, stock software, stock market, market, free, free software, charting tools, chart, stock chart, EOD, end-of-day, free EOD, technical analysis, stock analysis software, bull market, bull, bear market, bear
Add to Basket
VistaTrades

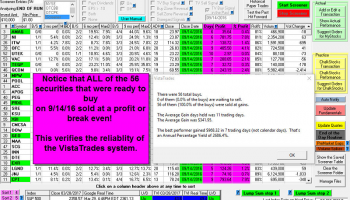
VistaTrades is a trading tool designed to help you stop guessing, and take the emotion out of trading in the stock market. Its an overbought/oversold screener that uses the trademarked TriVista Indicator (TVI) and the TriVista Signals. The TriVista Indicator is a proprietary blend of three overbought/oversold indicators, RSI, Stochastic and PercentR. The TriVista Buy Signals and the TriVista Sell Signals are generated based on the behavior of the TriVista Indicator. The TriVista Indicator has a value between 0 and 100, and the value from day to day is what is used to construct the purple TriVista Indicator graph. When the TriVista Indicator is greater than 70, the security or index is in the Sell Zone (overbought). When the TriVista Indicator is below 30, the security or index is in the Buy Zone (oversold). VistaTrades uses a screening method to come up with a list of potential stocks, ETFs, or mutual funds to buy on any given day in the past, or today. This is called the Screener and is usually run after the market has closed for the day, but can be run while the market is open using intraday prices. The Screener can also be set to look for potential sells, but only for todays data, not past data. Setting the Screener to look for potential buys in the past is for testing and validating VistaTrades: You pretend a past date is today, pick a few from the screener results for that day, and then see what would have happened had you actually bought them. VistaTrades uses a concept called Index Monitoring where it will constantly keep track of the TVIs on three major indexes; the Russell 1000 Index, the S&P 500 and the Nasdaq Composite. While the screener is running, the conditions of these three indexes will be shown in the lower left hand corner. If an index is overbought (TVI>70), the index and its TVI value will be colored red. If an index is oversold (TVI<30), it will be green. In between, blue. This function is always working.
OS: Win2000, Windows XP, Windows 7 x32, Windows 7 x64, Windows 8, Windows 10, WinServer, WinOther, Windows Vista, Windows Vista x64
Requirements: Windows
Add Your Review or 64-bit Compatibility Report
Top Investment Tools 64-bit downloads


Forex Strategy Trader 3.6.0.0
Forex Strategy Trader is a free trading platform working via Meta Trader
Freeware
tags: forex. expert advisor, forex trade

Forex Strategy Builder 3.8.0.0
Free Forex strategy tester, generator, optimizer! Tens of technical indicators.
Freeware


EvoAI 1.0.36
Multi-threaded MT4 walk forward optimisation, fast Dukascopy tick data download
Shareware | $5.00
Local Trade Copier 2.0
Local Trade Copier software copy Forex trades between Metatrader 4 accounts
Demo


IBTrader 1.7
Ease of trading commodities and their spreads through the Interactive Brokers
Shareware | $150.00
tags: IBTrader, trading, futures, commodities, spread, exchange, trading software, Interactive Brokers, MRCI, TWS
Members area
Top 64-bit Downloads
-
mbFXWords 2.80
x64 freeware download -
FontAgent Pro 10.0.15.0
x64 trialware download -
Microsoft Office 2016
x64 2405 B17628.20164
x64 trialware download -
Print to PDF Toolkit Pro 3.0
x64 shareware download -
Microsoft Office 2010
Service Pack x64 SP2
x64 freeware download -
PDFill PDF and Image
Writer x64 15.0 Build 2
x64 freeware download -
XLIFFChecker 7.5.0
x64 freeware download -
CSV2IIF Portable 5.0.060
x64 demo download -
Foxit Reader 2023.3
x64 freeware download -
Hl7Spy 24.1.227
x64 trialware download
Top Downloads
-
Quite Imposing Plus 6.0d
demo download -
Total CSV Converter 4.0
shareware download -
Active Barcode and QR
code Generator 1.24.8.15
freeware download -
mbFXWords 2.80
freeware download -
Seavus Project Viewer 19.0
trialware download -
Miro for Windows 0.11.110
shareware download -
Odoo 19.0.20260330
demo download -
Flipping Book Writer 2.6
shareware download -
SmarThru 4.04
freeware download -
SilentNotes 8.7.1
open source download -
LawTrust 5.1.1
shareware download -
HelpDesk 11.19.9557.25020
trialware download -
DeskWork Standard 4.0.2827
trialware download -
LiquiBase 5.0.2
trialware download -
4EPOS POS 12.20.48
demo download